THIS IS YOUR OFF-SITE CROP ANALYTICS DEPARTMENT
Volatile Ag -Agricultural Drone Surveys
Fast and Accurate Crop Surveys for the Columbia River Gorge

Giuseppe Venneri - Your Solutions Provider
We help farmers save time and money by doing their crop and yield estimates in a fraction of the time of traditional in-field methods
Our Services
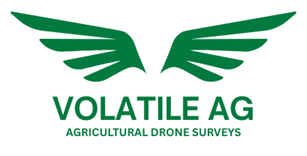
Visible Light, Multispectral, and Thermal maps of farmland with trouble spots identified
Crop Count and Yield Estimates
Access to survey data through our online client portal
Free demo for first time clients
Agricultural Drone Survey Applications
Precision Farming
Drone data arms farmers with actionable insights to optimize crop health and yield potential.
Proactive Health Checks: Provide an early warning system, revealing issues like plant stress, nutrient shortages, or disease long before they are visible to the naked eye.
Smarter Treatment Use: Instead of a uniform application, allow for a targeted approach. Precisely apply fertilizers, pesticides, and water only to the specific areas that need them, boosting efficiency and cutting waste.
Precise Weed Control: Tell the difference between your crops and weeds, allowing for highly targeted herbicide application that saves money and minimizes chemical use.

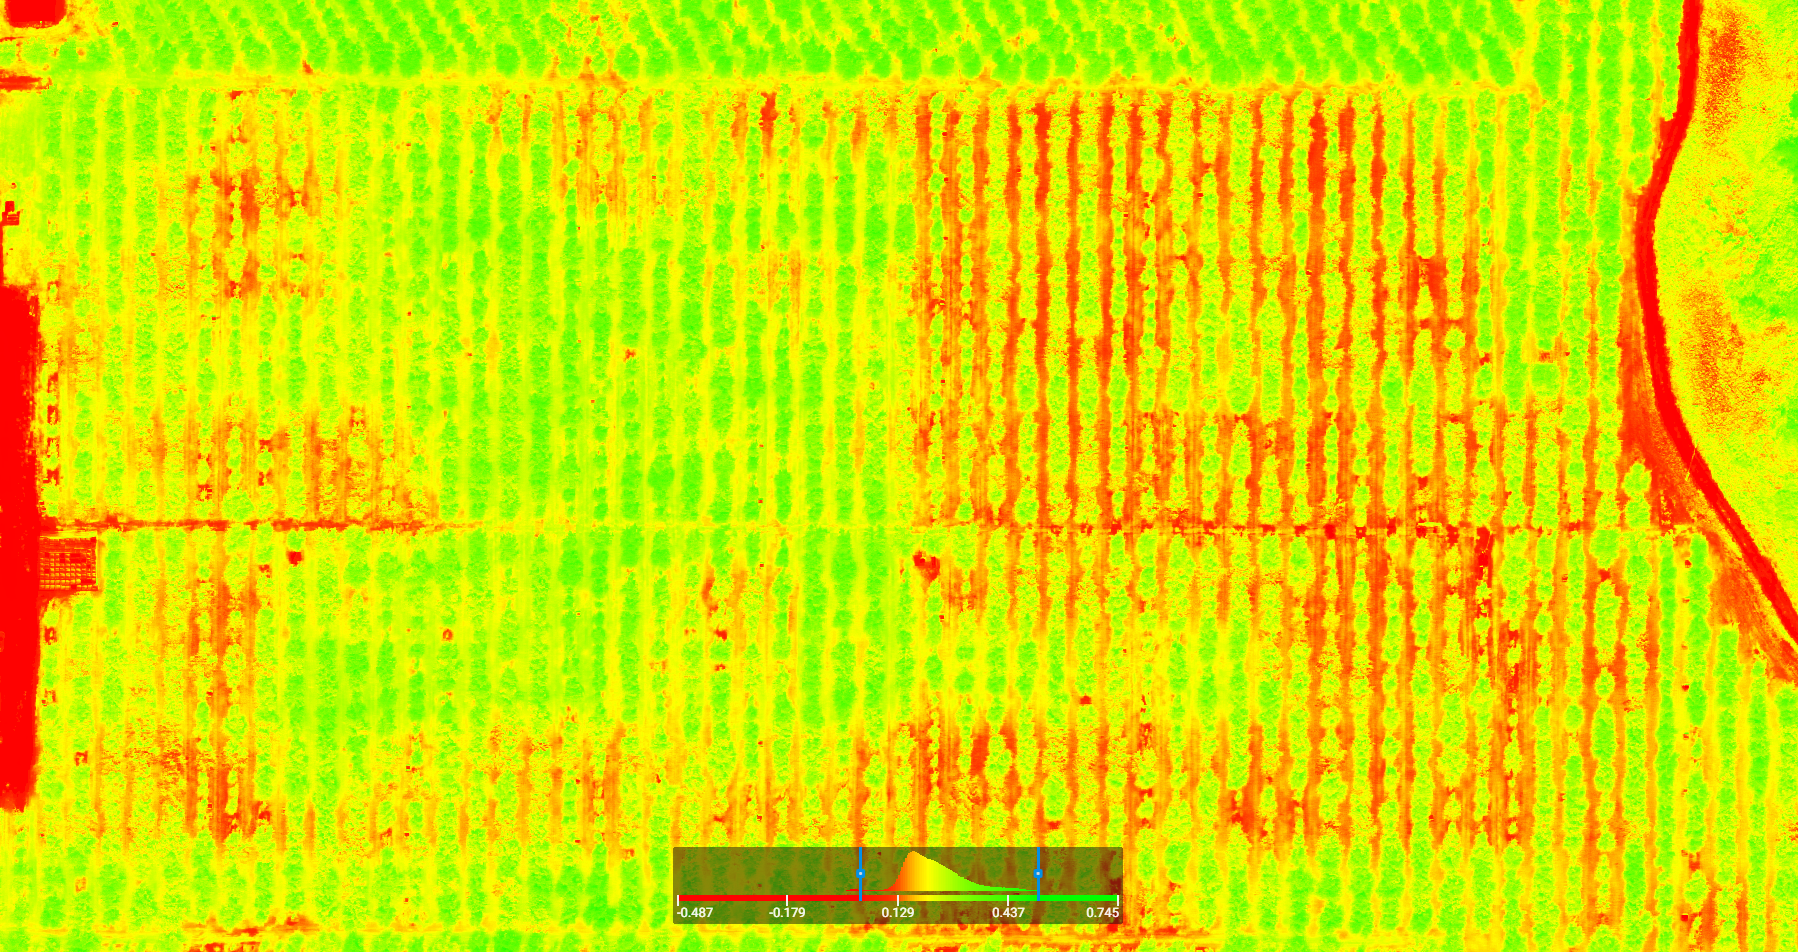
Orchard Surveys
Use detailed mapping to evaluate the health and productivity of individual trees within an orchard or plantation.
Canopy and Tree Health: Use Near-Infrared (NIR) data to accurately measure canopy density and identify underperforming or unhealthy trees within an orchard or plantation.
Early Pest and Disease Detection: Zero in on potential infestations or diseases in their early stages by analyzing Red Edge and thermal imagery, allowing for targeted intervention.
Predictive Yield Estimation: Utilize aerial drone data to forecast fruit yield by monitoring flowering and fruiting stages throughout the growing season.
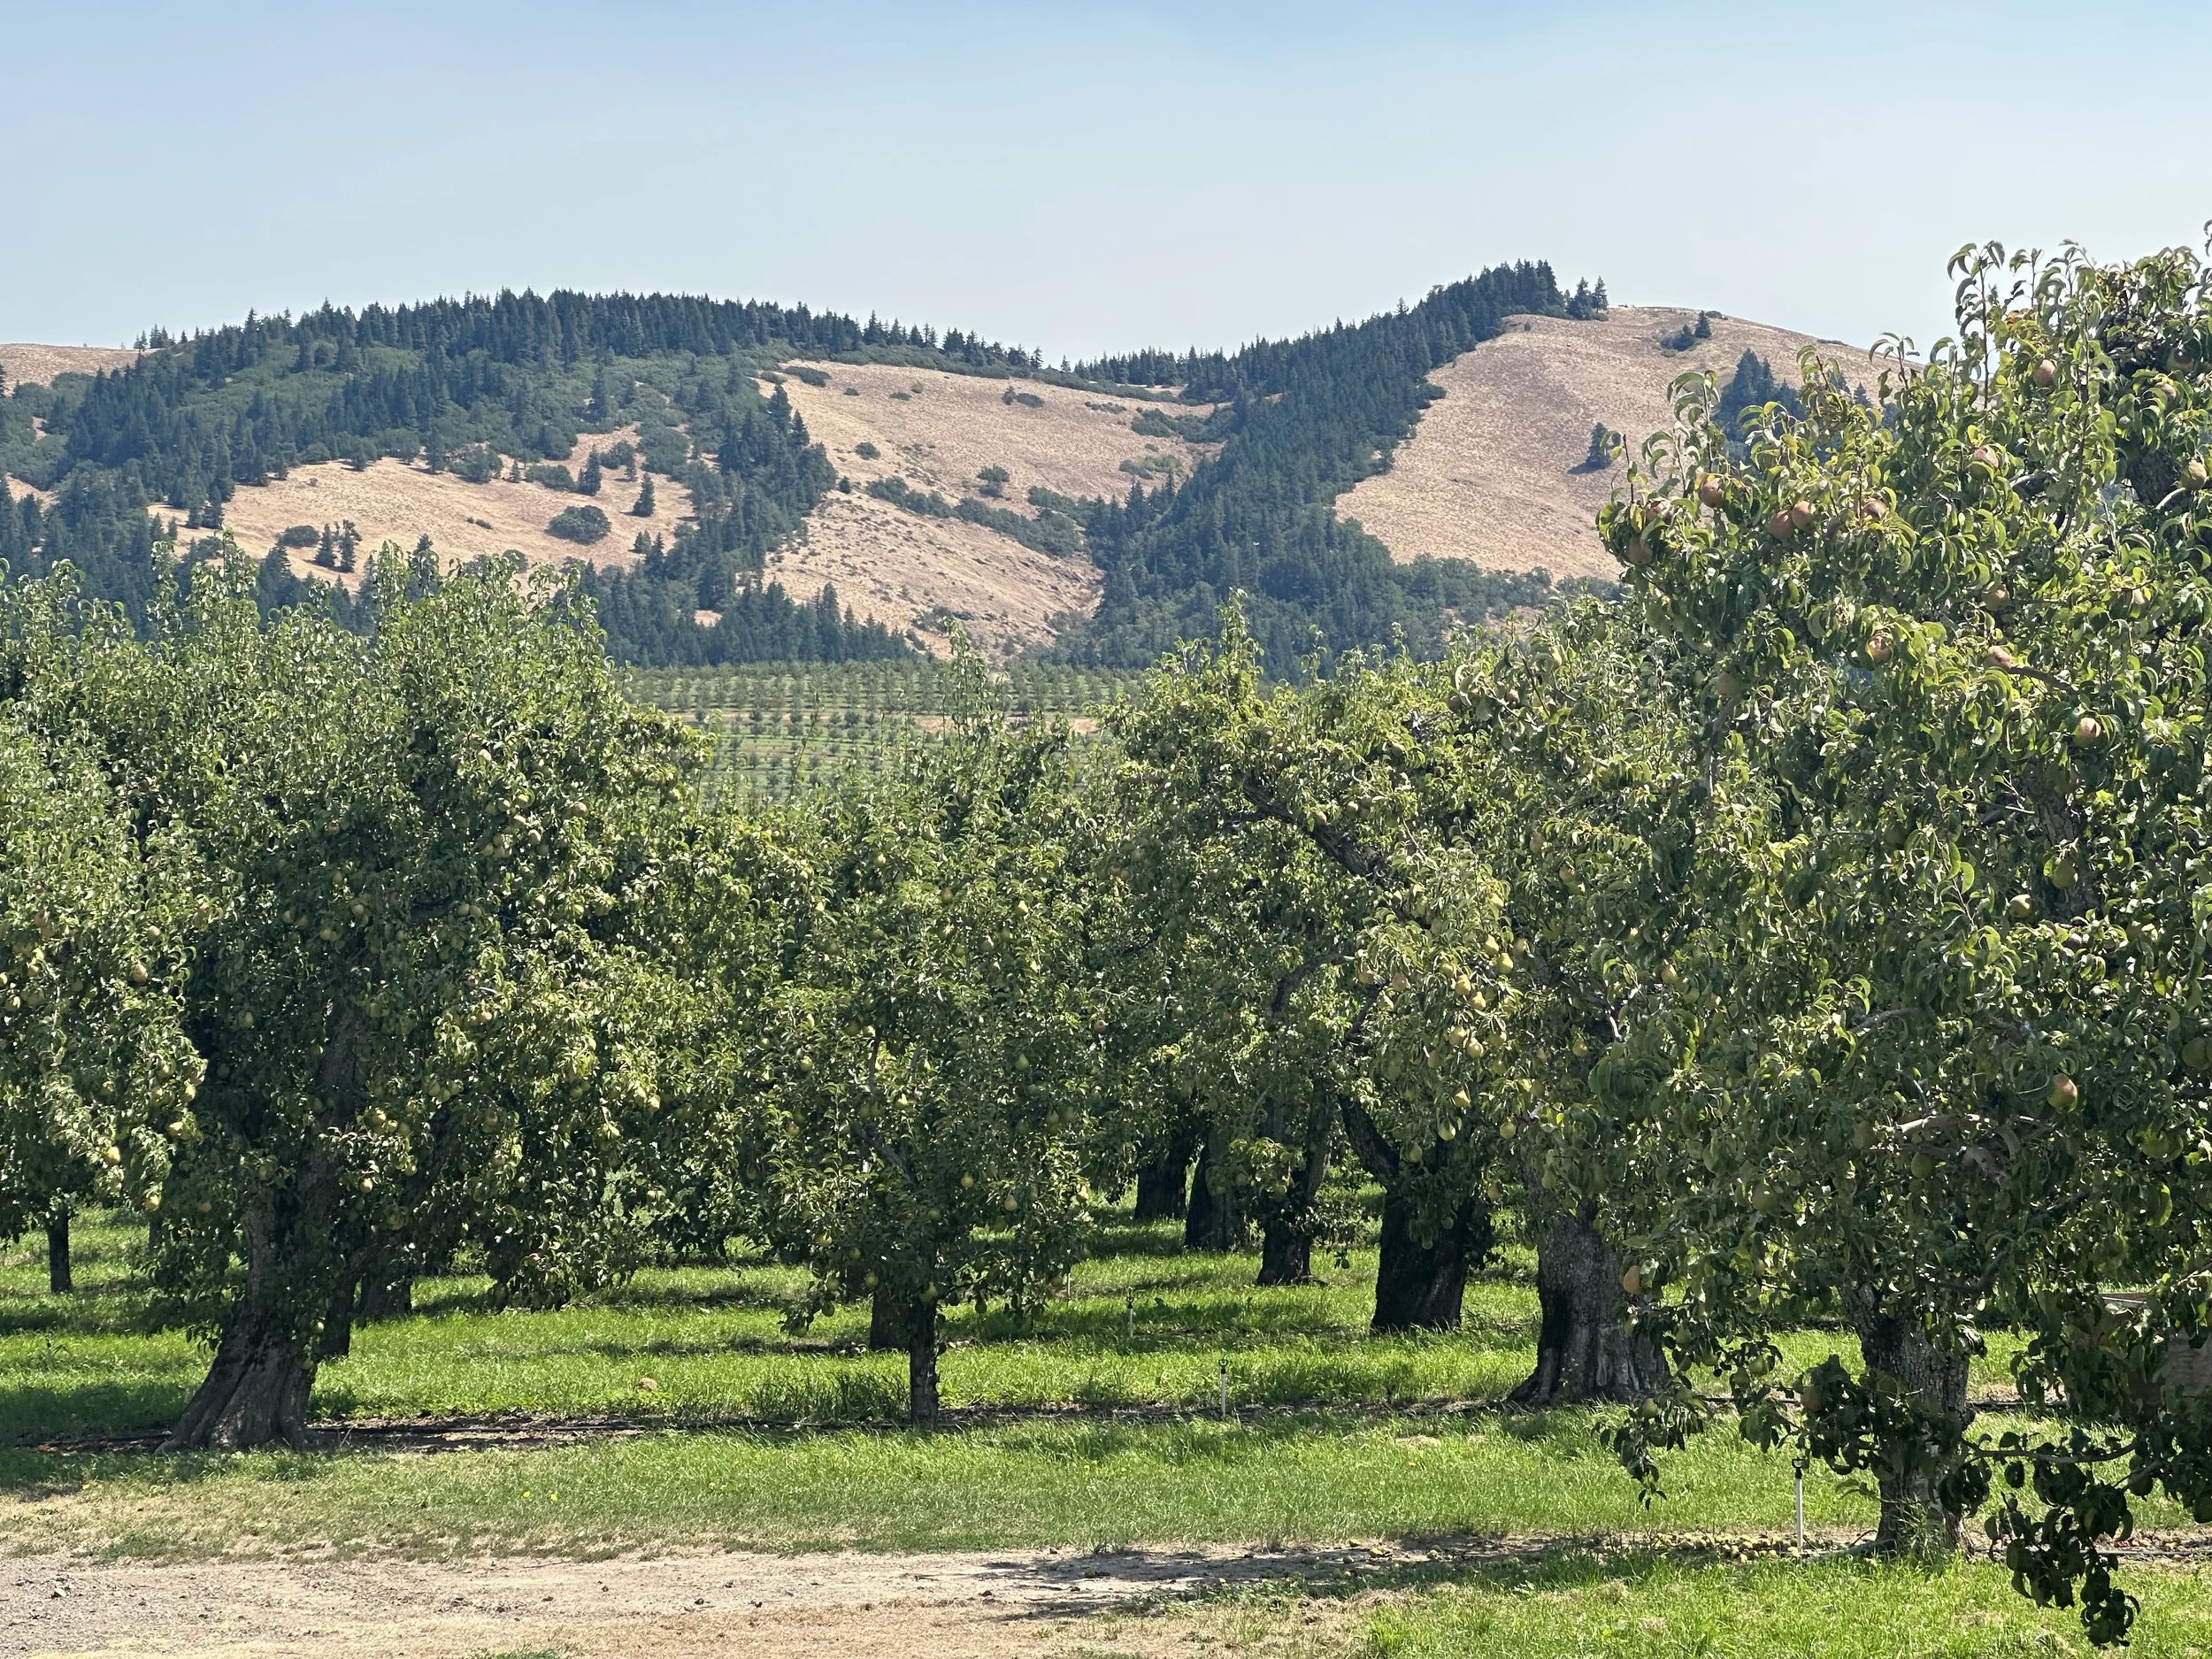
Disaster Response and Recovery
Multispectral imagery is a powerful tool for enhancing long-term recovery efforts after disasters like floods, fires, and hurricanes.
Damage Assessment: Use multispectral data to quickly and accurately assess the extent of crop loss or infrastructure damage following a natural disaster.
Post-Fire Recovery: Monitor reforestation and vegetation regrowth after wildfires by analyzing specific light bands like Red Edge and NIR.
Orchard Monitoring Year Round
At Blossom
Optimize your yield and fruit quality from the start, with access to every blossom from every tree.
Capture blossom variability
Early yield indicators
Informed thinning
Full Crop Cycle Load Management
Map crop loading and immediately optimize your strategy to produce fruit to spec throughout the whole field.
No more hand counts
Targeted thinning and pruning
Accurate yield estimates
Sales Forecast
Confidently inform your supply chain, from picking and packing, to transport and sales of your yield estimate.
Fast and low cost yield estimates
Plan harvest with ease
Negotiate with real estimates
About
our company
Volatile Ag Surveys is a small drone service startup in the Columbia River Gorge specializing in the inspection of farmland at a fraction of the cost and time of traditional surveys. Our mission is to create relevant, digestible, and high-quality crop health reports for small family-owned farms that will help them save on labor and improve yield.

Contact Us
Interested in working together? Fill out some info and we will be in touch shortly. We can’t wait to hear from you!